|
|
| Home |
|
Documentation Screenshots Download/Sources Links Roadmap Bugs & Wishes

|
 |
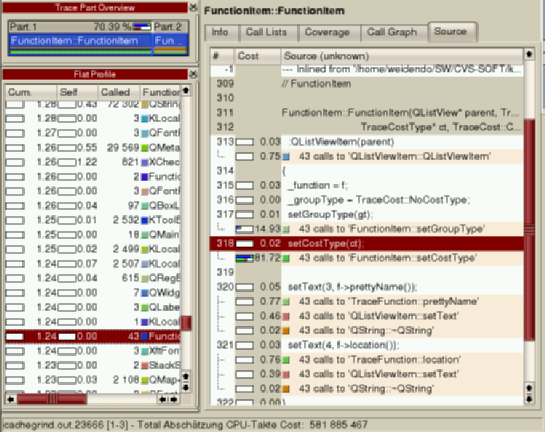
Screenshot 4Source intermixed with profiling data.
KCachegrind can show line by line information of cost spent in your program. This needs compilation with debug info enabled (Option -g), and access to the source. There is no dependence on a particular programming language. In this screenshot, grouping "Class" is selected (this grouping is only usefull for C++). Visualisation in the "Trace Part Overview" is 'Partitioning'. You see the partitioning of the runtime dependent on the class of the functions executed.
|