|
|
| Home / Documentation / Screenshots |
|
Documentation Screenshots Download/Sources Links Roadmap Bugs & Wishes

|
 |
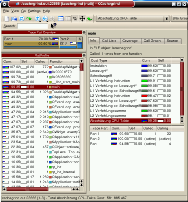
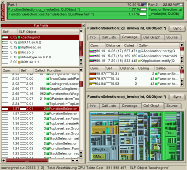
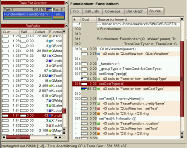
ScreenshotsThese screenshots show KCachegrind with a profiling trace of itself. The trace consists of several parts. Click on the images to see them enlarged, together with a more detailed explanation of what can be seen.
|