
 |
 |
| Home |
|
Documentation Screenshots Download/Sources Links Roadmap Bugs & Wishes

|
 |
The Tree Map VisualisationTree Maps are used to show the nesting of objects with an attached metric. The metric has to have the property that the sum of the metric of children of an object is smaller then the metric of an object itself.Tree Maps are nested rectangles. Each object is represented by an rectangle, and the metric of the object equals the area of the rectangle. Thus, sub-rectangles of children fit into the objects rectangle because of the above mentioned property. Unfortunately, this doesn't always hold true: in the tree map visualisation, you don't want to have a rectangle frame overwritten by children rectangles for easy detection of nesting. In contrast to an rectangle area, the actual width and height can be choosen arbitrary. To limit the error produced by visible frames, a rectangle should be as quadratic as possible, as an 2 pixel border takes less space this way. Different algorithms exist for this goal. The most used are:
Still, the error produced by borders can become large. Therefore, there is on drawing option to overwrite parent borders to get back to exact area proportions.
Example
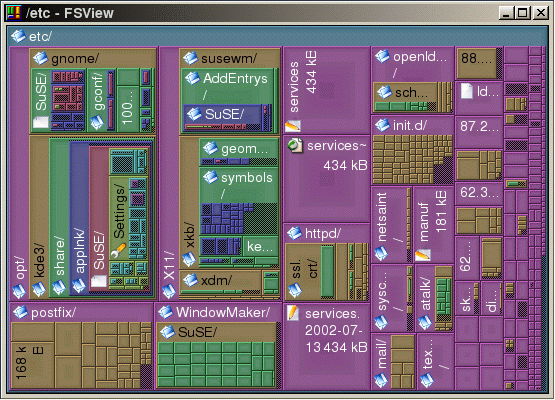
In KCachegrind, Tree Maps are used to show the call hierarchy of an application. Another possible usage for Tree Maps is a graphical version of the UNIX command line tool "du" (disk utilisation). Nodes are files or directories on a file system. The metric is the size of files or directories, with the size of directories defined as the sum of children sizes. As one can see, big files even deep down in the directory hierarchy can be spotted easily. Shown is the directory /etc from a Suse 8.0 distribution. The TreeMap widget is the same as the one used in KCachegrind. The application currently can be found in KDE CVS, kdenonbeta/fsview, to be moved to kdeaddons and packaged with KDE 3.2.
|